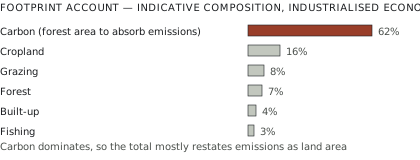
Ecological footprint accounting converts consumption into the land and water area required to sustain it. Applied to Gauteng — South Africa’s smallest province by area and largest by population and economic output — it produces a result that illustrates both what the method shows well and where it is contested.
What the method measures
The footprint expresses consumption in global hectares: hectares of biologically productive land or water, normalised to world-average productivity so that different land types and countries can be compared.
The accounting covers cropland, grazing land, forest, fishing grounds, built-up land, and the forest area that would be required to absorb carbon emissions. That last component — the carbon footprint — dominates the total for any industrialised economy, and it is the element that attracts most of the methodological argument.
Against the footprint sits biocapacity: the productive area actually available within the territory. Where footprint exceeds biocapacity, the territory runs an ecological deficit, meeting its consumption through trade or through depletion.
Why an urban region is a useful unit
National accounts are the standard application, but a city region is more instructive in one respect: the deficit is unambiguous and structurally inevitable.
No dense urban area can produce its own food, fibre and fuel within its boundary. The footprint of a city will always exceed its biocapacity by a large multiple, and this is not a finding about the city’s efficiency — it is what a city is. Cities exist by concentrating consumption and importing the productive capacity to support it.
What the regional footprint therefore reveals is not that the deficit exists but its composition, its size relative to comparable regions, and which components drive it.
Gauteng’s position
Gauteng contains Johannesburg and Pretoria, holds a quarter of South Africa’s population on under two per cent of its land area, and generates roughly a third of national GDP.
Two features shape its footprint.
The energy system. South African electricity has been overwhelmingly coal-fired, with among the highest carbon intensities per kilowatt-hour of any major grid. Because the carbon component dominates footprint accounts, this pushes the total sharply upward relative to a region of comparable income on a cleaner grid — the same consumption, a much larger footprint, purely through the supply mix.
Extreme internal inequality. Gauteng contains both high-income consumption comparable to wealthy economies and large low-income populations. An average footprint across that distribution describes nobody. The affluent minority’s individual footprint substantially exceeds the mean; the majority’s falls well below it.
This is the most important reading of the result, and it is the one an aggregate figure obscures most effectively.
The criticisms
The method is widely used and seriously contested, and the objections are worth stating.
The carbon component is an artefact. Converting emissions into a hypothetical forest area is one of several possible representations, and it is not the one climate science uses. Because this component dominates, the total is heavily shaped by a modelling choice rather than by a measurement.
Aggregation hides substitution. Different land types have different ecological significance, and expressing all of them in a single unit implies a substitutability that does not exist. A hectare of cropland and a hectare of rainforest are not interchangeable.
It omits much of what matters. Freshwater use, toxicity, biodiversity loss, soil degradation and non-renewable resource depletion are outside the accounts. A region could reduce its footprint while degrading its environment on dimensions the method does not see.
Deficits are not necessarily unsustainable. A region running an ecological deficit through trade is doing what trade exists for. The footprint becomes a sustainability statement only at global scale, where trade cannot resolve it.
What it is genuinely good for
The defence is that the method’s value is communicative rather than analytical.
A single intuitive number allows comparison across regions and time, and it makes the scale of resource consumption legible to people who will not read a multi-indicator dashboard. For regional planning, tracking the footprint over time reveals direction even if the absolute level is contestable.
Used that way — as one indicator among several, with its composition disaggregated and its limits stated — it does work that more rigorous methods do less effectively. Used as a single sustainability verdict, it claims more than it can support.
What to use alongside it
The standard response to the footprint’s limitations is not to abandon it but to read it with companions that cover what it misses.
Material flow accounting tracks physical quantities of materials through an economy — extraction, imports, exports, accumulation in stock — without converting anything into land area. It answers a different question and answers it without a modelling assumption.
Planetary boundaries frames sustainability as a set of biophysical thresholds — climate, biosphere integrity, nitrogen and phosphorus flows, freshwater, land use change — rather than as a single aggregate. It preserves the distinction between dimensions that the footprint collapses.
Life cycle assessment examines specific products and processes across many impact categories, giving detail the footprint cannot approach at the cost of scope.
Water footprint accounting isolates freshwater, the resource the ecological footprint treats least well and which is the binding constraint across much of southern Africa.
Used together, these give a picture in which the ecological footprint’s role is clear: it is the communicative summary, not the analysis.
The Gauteng result in a policy frame
For regional planning, the disaggregation matters more than the total.
If the carbon component dominates, and the carbon component is driven by grid intensity, then the single largest lever on Gauteng’s footprint sits with national electricity policy rather than with anything a provincial or municipal authority controls. Decarbonising the grid would reduce the region’s footprint substantially without any change in what residents consume.
That is a genuinely useful finding and it is one the aggregate figure obscures. A region told its footprint is too high may reach for demand-side interventions — recycling, behaviour campaigns — that address components contributing a small fraction of the total.
The second implication concerns equity. Where consumption is as unequally distributed as it is in Gauteng, an average-based target implies very different things for different households. Reduction achieved by constraining the consumption of people whose footprint is already below a sustainable share is both ineffective and regressive.
The global overshoot framing
The footprint’s most publicly visible output is Earth Overshoot Day, the date by which humanity’s annual demand is calculated to exceed what the biosphere regenerates in a year, and it is worth understanding what that date does and does not represent.
The calculation divides global biocapacity by global footprint and expresses the ratio as a date. It is arithmetic applied to the accounts rather than an independent measurement, so every criticism of the accounts applies to the date, amplified by the precision the format implies. A day-level figure suggests accuracy the underlying data cannot support.
The carbon component again dominates: the majority of the calculated overshoot is the hypothetical forest area required to sequester emissions, so Overshoot Day is substantially a restatement of the emissions problem in land-area units.
Its defenders make an explicitly communicative case. The date is memorable, it moves earlier in most years, and it generates coverage that nothing in the underlying literature achieves. As advocacy it demonstrably works.
The risk is that a figure designed for communication is received as measurement, and that critics correctly identifying its limitations are heard as disputing the underlying problem — which is not in question and rests on entirely separate evidence.
Using it for a city rather than a nation
If the method is applied to an urban region at all, a few practices make the result more defensible.
Report the components, not just the total. The carbon share is the single most useful number and is usually the one omitted from summaries.
Disaggregate by income where the data allows. An average across an unequal population describes nobody and misdirects policy towards the wrong households.
Use a consumption basis and say so. A production-based account attributes emissions to where goods are made; a consumption-based one attributes them to where goods are used. For a city region importing most of what it consumes, the difference is enormous and the choice is not neutral.
Track direction rather than level. The absolute figure carries methodological baggage; the year-on-year change under a consistent method is more robust and is what a planning authority can act on.
Pair it with an indicator the method omits. Water stress is the obvious companion in a southern African context, and it is the constraint most likely to bind first.
The biocapacity side
Attention concentrates on the footprint and the other half of the ledger is less examined, though it carries its own assumptions.
Biocapacity is calculated from land area weighted by yield, which means it rises when agricultural productivity rises. A country that intensifies farming increases its measured biocapacity, and therefore reduces its measured deficit, even where the intensification depends on fossil inputs and degrades the soil.
That is a genuine perversity in the accounting. It also means biocapacity figures are sensitive to yield data quality, which varies considerably between countries.
For South Africa, water is the binding constraint on biological productivity across much of the territory, and it does not appear in the biocapacity calculation at all.
Where the primary material sits
The Gauteng analysis was published by Springer in the urban sustainability literature. The methodology itself is maintained by the Global Footprint Network, which publishes national accounts annually and documents its calculation approach. The critical literature is substantial and largely in ecological economics journals; reading it alongside the accounts is the only way to use the numbers responsibly.